DuPont Analysis: Is ROE Rising on Margin, Asset Use or Debt?
A higher ROE can come from debt rather than a better business. Split ROE into profit margin, asset turnover and the equity multiplier, with a worked example and how to act on the result.
In this article
Return on equity (ROE) is one of the numbers owners, investors and banks look at most, because it answers a plain question: how much profit does every 100 baht of shareholders' money earn in a year? Yet a rising ROE does not always mean a better business. ROE can rise because each sale earns more, because the assets work harder, or because the company borrowed more. Those three routes carry very different risks.
DuPont analysis splits ROE into three parts so you can see which one moved it. This article covers the formula, how to run it on your own financial statements, a worked example in which ROE improves while the business gets worse, and how to use the result to decide what to fix first.
What ROE Measures, and Why One Number Is Not Enough
OpenStax's Principles of Finance defines ROE as a company's ability to use its invested capital to generate income, calculated as net income divided by average shareholders' equity.
ROE = Net income ÷ Average shareholders' equity
Average equity is the opening balance plus the closing balance, divided by two. That denominator can shrink in two ways: the company earns little or loses money, or it pays out large dividends and replaces the cash with loans. Both make ROE look better while the business itself has not improved. That is why you need to look inside the number.
The Three-Part DuPont Formula
According to OpenStax, the method originated in 1919, when the DuPont company used it for internal measurement. It spread because each of its three parts points to a different area of the business.
ROE = Net profit margin × Total asset turnover × Equity multiplier
= (Net income ÷ Sales) × (Sales ÷ Average total assets) × (Average total assets ÷ Average shareholders' equity)
- Net profit margin: how many baht of every 100 baht of sales end up as net profit. It reflects pricing, costs and overheads.
- Total asset turnover: how many baht of sales each baht of assets produces in a year. It reflects inventory, receivables, machinery and cash that sits idle.
- Equity multiplier: total assets as a multiple of shareholders' equity. It measures leverage. A multiplier of 2 means total liabilities equal equity; a multiplier of 4 means liabilities are three times equity.
Multiply the three and sales and total assets cancel out, leaving net income over equity. The formula gives no new number; it shows where ROE comes from. One rule matters: use the same denominators throughout. If you use average assets in the second part, use average assets in the third part too, or the product will not equal ROE.
Worked Example: ROE Rises While the Business Gets Worse
An illustrative example: a distribution company reports the following for two years. In 2025 it paid a large dividend and borrowed to buy more inventory. All figures are full-year, and assets and equity are averages.
| Item | 2024 | 2025 |
|---|---|---|
| Sales | 50,000,000 | 54,000,000 |
| Net income | 2,500,000 | 2,160,000 |
| Average total assets | 25,000,000 | 30,000,000 |
| Average shareholders' equity | 12,500,000 | 7,500,000 |
| ROE | 20.0% | 28.8% |
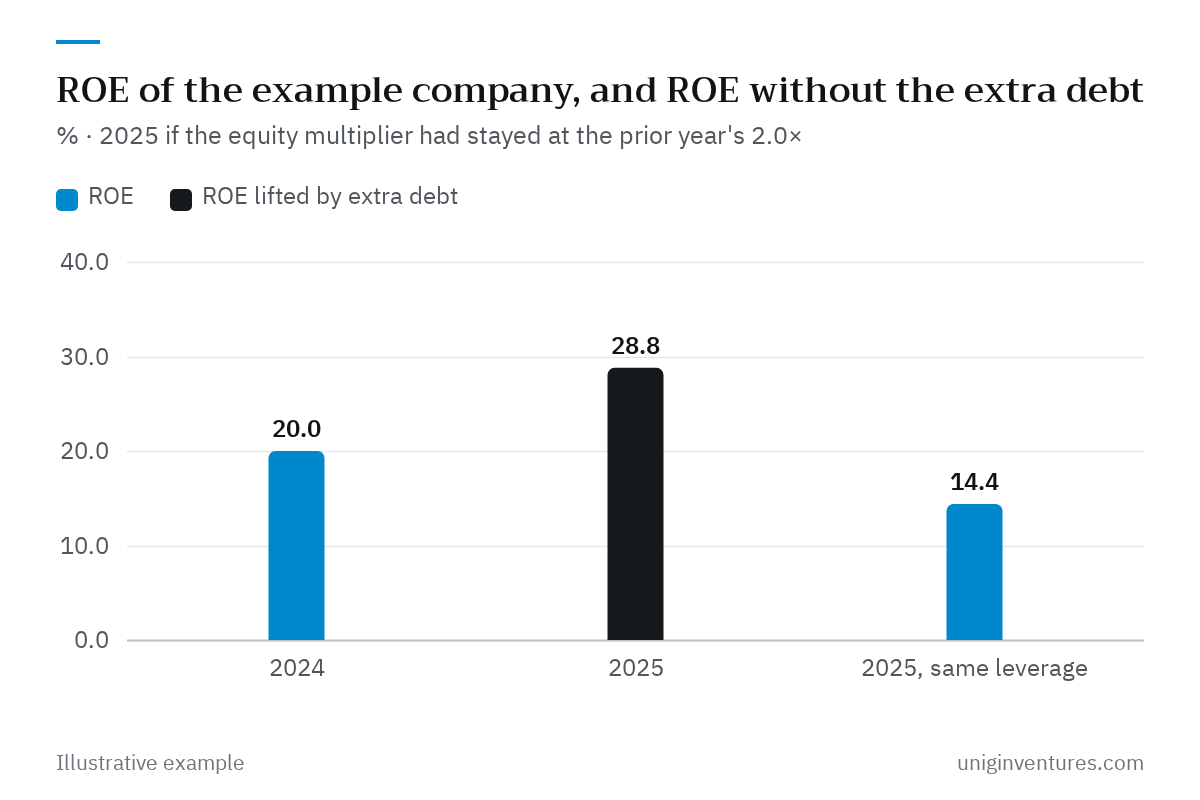
On the bottom line alone, 2025 looks much better: ROE rose from 20.0% to 28.8%. Split it into three parts and a different picture appears.
| Component | 2024 | 2025 |
|---|---|---|
| Net profit margin | 5.0% | 4.0% |
| Total asset turnover | 2.0× | 1.8× |
| Equity multiplier | 2.0× | 4.0× |
| ROE | 20.0% | 28.8% |
The first two parts both got worse. Profit per sale fell from 5.0% to 4.0%, and each baht of assets produced less in sales, down from 2.0 to 1.8 baht, because inventory grew faster than sales. The only thing that lifted ROE was debt: the multiplier went from 2.0× to 4.0×, so total liabilities went from equal to equity to three times equity. Return on assets (net income ÷ average total assets) tells the same story, falling from 10.0% to 7.2%.
How Much Each Part Moved ROE
The simplest method is to change one part at a time, in order, and record how ROE moves at each step.
- Change the margin from 5.0% to 4.0%, holding the other two: 4.0% × 2.0 × 2.0 = 16.0%. ROE falls 4.0 points.
- Change asset turnover from 2.0× to 1.8×: 4.0% × 1.8 × 2.0 = 14.4%. ROE falls another 1.6 points.
- Change the multiplier from 2.0× to 4.0×: 4.0% × 1.8 × 4.0 = 28.8%. ROE rises 14.4 points.
Together that is −4.0 − 1.6 + 14.4 = +8.8 points, exactly the move from 20.0% to 28.8%. The step figures shift somewhat if you change the order, but the direction and overall size do not, and that is enough to decide where to act.
The Five-Part Version: How Much Interest Eats
CFA Institute describes the five-part DuPont decomposition as expressing ROE as a function of the tax rate, interest burden, operating profitability, efficiency and leverage. In practice it splits the net profit margin into three smaller parts.
Net profit margin = (Net income ÷ Pre-tax income) × (Pre-tax income ÷ Operating income) × (Operating income ÷ Sales)
Operating income here means earnings before interest and taxes (EBIT). In the same example, assume tax is 20% of pre-tax income in both years.
| Item | 2024 | 2025 |
|---|---|---|
| Operating income (baht) | 3,500,000 | 3,780,000 |
| Interest expense (baht) | 375,000 | 1,080,000 |
| Pre-tax income (baht) | 3,125,000 | 2,700,000 |
| Operating margin | 7.0% | 7.0% |
| Interest burden (pre-tax ÷ operating income) | 0.89 | 0.71 |
| Tax burden (net ÷ pre-tax income) | 0.80 | 0.80 |
| Net profit margin | 5.0% | 4.0% |
Now the picture is sharper. The core business earned the same 7.0% of sales in both years; the lower net margin came entirely from interest. In 2024 interest took 10.7 baht of every 100 baht of operating income; in 2025 it took 28.6 baht. The debt that pushed ROE up is also eating profit, and if sales fall, the interest bill does not fall with them.
Reading the Result: Where to Act
Low or Falling Margin
Look at prices, product mix and costs, and find which products or customer groups drag the margin down. A gross margin bridge explains whether gross profit moved because of price, mix or cost, and contribution margin by product shows which products really make money. If the five-part split shows operating margin unchanged but a worse interest burden, the problem is the debt structure, not sales.
Slower Asset Turnover
Find which assets grew faster than sales. Usually it is inventory and trade receivables, the two items that grow quietly every month. See the cash conversion cycle and ABC inventory management. Machinery, vehicles or land that sit underused weigh on this number as well.
Rapidly Rising Multiplier
ROE driven by debt is not always wrong. If operating income on assets exceeds the cost of debt, borrowing does raise the return to shareholders. But check two things before you are pleased with the number. First, is there enough cash flow to pay principal and interest? See the DSCR banks use. Second, does your loan agreement set a debt-to-equity limit, and how much headroom is left before a breach? See loan covenants.
Cautions for SMEs
- Negative or near-zero equity makes ROE abnormally high or meaningless. Use return on assets and cash flow instead.
- Owner pay: a company whose owner draws a high salary shows lower net income than one whose owner takes dividends. Adjust for this before comparing with other firms (see salary or dividends).
- Compare like with like: retailers run thin margins with fast turnover, while machine-heavy businesses earn higher margins with slower turnover. Thai limited companies' filed financial statements are searchable in the Department of Business Development's DBD DataWarehouse+, so you can calculate the three parts for competitors in your own industry.
- Use full-year figures: with monthly or quarterly statements, annualize sales and profit first, or turnover and ROE will look too low.
Where to Start
- Open your last two years of financial statements and find average total assets and average equity (opening plus closing, divided by two).
- Calculate the three parts for each year, then multiply them back to check they equal ROE calculated directly.
- Change one part at a time, as in the example, to see which part moved ROE the most.
- If the multiplier is the main driver, run the five-part split to see the interest burden, then check your DSCR and loan covenants.
- Set next year's targets by component, for example a 7.5% operating margin and 2.0× asset turnover, rather than a single ROE target that more borrowing can hit.
The company and figures in this article are an illustrative example. This article is general information, not financial or investment advice for any particular business.