KPIs for a Small Team: Pick 5–7 Numbers You Act On Every Week
How to choose key performance indicators across cash, sales, margin, customers and operations, mix leading and lagging measures, set alert levels, and run a 30-minute weekly review.

In this article
Most small companies do not lack numbers. The accounting software has reports, the online shop has a dashboard, and the social media pages count every like. What they lack is a short list of numbers the team actually looks at every week and uses to decide what to do next. Without that list, problems show up in the monthly accounts, often a month or two after they could have been fixed.
This article shows how to choose five to seven key performance indicators (KPIs) for a small team, how to set a target and an alert level for each, how to run a short weekly review, and how to avoid the common ways KPIs go wrong.
A KPI Is a Number That Triggers a Decision
A useful test for any metric: if this number moves sharply next week, will someone do something different? If the answer is no, it is information, not a KPI.
Numbers that look good but drive no decision are often called vanity metrics. Page followers, total app downloads and gross sales without margin are typical examples. They tend to go up over time and rarely tell you where the problem is. Compare them with numbers that point to an action:
- "Sales rose 20%" says little. "Gross margin fell from 31% to 26% because of discounts on two product lines" tells you exactly where to look.
- "We have 5,000 followers" says little. "Only 8% of first-time customers bought again within 90 days" tells you to work on the second purchase.
Every KPI should come with four things written down: the exact formula, where the data comes from, how often it is updated, and one named person who owns it.
Mix Leading and Lagging Indicators
Lagging indicators report results that have already happened: revenue, profit, cash at month end. They matter, but by the time they move, it is usually too late to change that month.
Leading indicators move before the result does. The value of open quotations predicts next month's sales. The share of orders shipped on time predicts complaints and lost repeat orders. Overdue receivables predict a cash squeeze.
This is the idea behind the balanced scorecard that Robert Kaplan and David Norton described in Harvard Business Review in 1992: financial measures alone can give misleading signals, so they should sit alongside measures of customers, internal processes, and learning and improvement. A small team does not need the full framework. It only needs to make sure the list is not all lagging financial numbers.
Choose Five to Seven KPIs, One per Area
Pick one or two KPIs for each area that drives your business. More than seven and the weekly review turns into reading a report. The table below is an illustrative example for a 12-person distribution company that sells on credit to business customers.
| Area | KPI and formula | Frequency | Target | Alert |
|---|---|---|---|---|
| Cash | Months of cash = cash balance ÷ average monthly cash expenses | Weekly | ≥ 3 months | < 2 months |
| Collections | DSO = trade receivables ÷ credit sales × days in period | Monthly | ≤ 45 days | > 60 days |
| Sales (leading) | Open quotations ÷ monthly sales target | Weekly | ≥ 3× | < 2× |
| Margin | Gross margin = gross profit ÷ sales | Monthly | ≥ 30% | < 25% |
| Customers | Share of customers who ordered last quarter and ordered again this quarter | Monthly | ≥ 70% | < 60% |
| Operations | On-time delivery = orders delivered by the promised date ÷ all orders | Weekly | ≥ 95% | < 90% |
Your list will look different. A software subscription business would track monthly recurring revenue and churn (see MRR, churn and cohorts). A business that spends heavily on ads would track customer acquisition cost and payback (see unit economics). A business with a lot of stock would watch the cash conversion cycle (see the cash conversion cycle). The principle is the same: one number per area that matters most right now.
Set a Target and an Alert Level
A target says where you want to be. An alert level says when the team must stop and act. The gap between the two is a zone where you watch the trend but do not need a meeting.
- Base targets on your own history first. Take the average of the last 6–12 months and set a target that is a reasonable step better. Targets copied from other companies often do not fit your business model.
- Write down what happens at the alert level. For example: "If on-time delivery is below 90% for two weeks in a row, the operations lead reports the cause and a fix at the next weekly meeting."
- Look at the trend, not only the latest point. Three weeks of steady decline inside the target zone can matter more than one bad week.
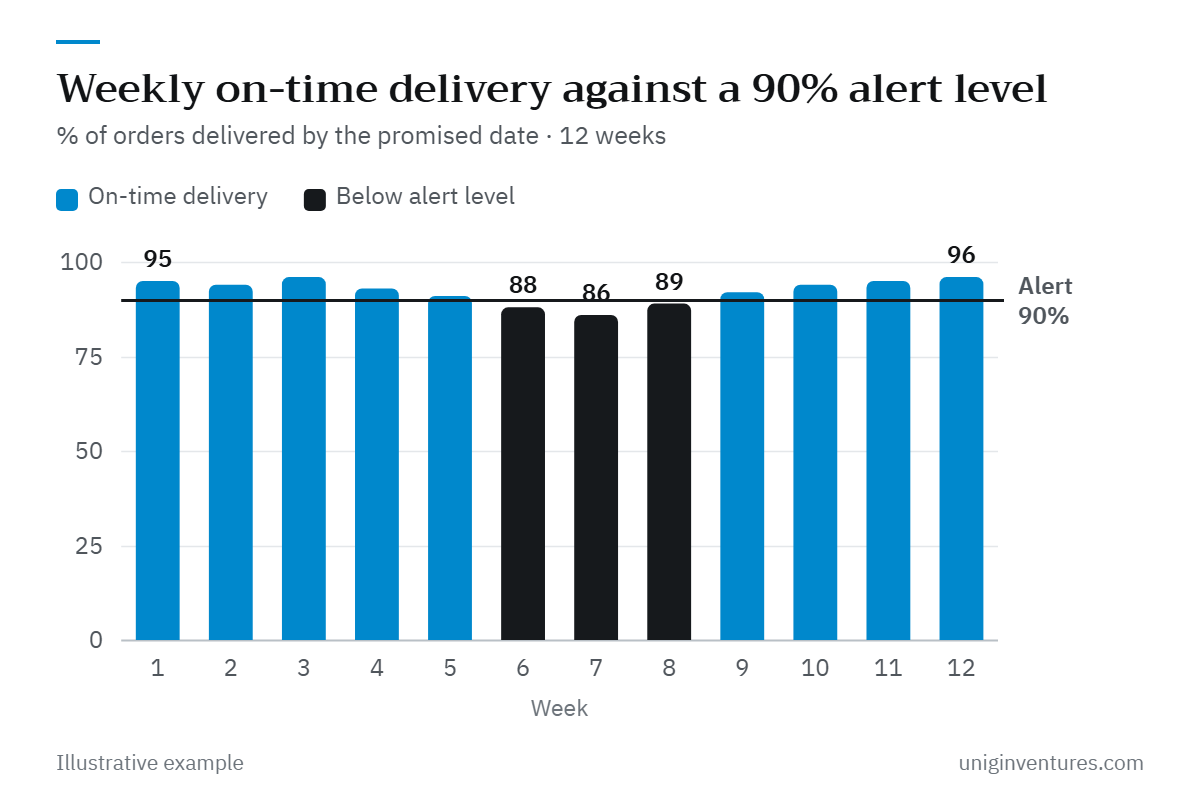
In this illustrative example, on-time delivery fell below 90% in week 6. The review found that one supplier had started shipping late and orders were being promised on the old lead time. The team quoted a longer lead time for that supplier's products and moved part of the volume to another supplier. The number recovered from week 9.
How KPIs Go Wrong
- Too many numbers. A dashboard with 30 metrics gets glanced at, not used. If everything is a KPI, nothing is.
- No owner. A number the whole team owns is a number nobody owns. Each KPI needs one person who explains it every week.
- Changing definitions. If "on time" means the promised date one month and the requested date the next, the trend is meaningless. Write the definition down and keep it.
- People hit the number instead of the goal. Once a measure is used as a target, especially one tied to pay, people find ways to move the number without improving the business. Staff measured only on on-time delivery may simply promise later dates. Pair such KPIs with a counterweight, such as quoted lead time or customer complaints.
- Measuring without deciding. If the meeting reads the numbers and ends, the KPI has no value. Every alert should end with an owner, an action and a date.
A 30-Minute Weekly Review
Run the same short meeting at the same time every week. A simple agenda:
- Five minutes: the scorecard. Show every KPI with its last eight weeks or months, target and alert level. Use the same layout every time.
- Fifteen minutes: anything in alert or trending the wrong way. The owner explains the cause and proposes an action.
- Ten minutes: follow up last week's actions. Done, not done, and what changed.
Update the numbers before the meeting, not during it. At the start, a shared spreadsheet that pulls from the accounting system and order records is enough. Buy a dashboard tool only once the team uses the numbers every week.
Where to Start
- List the decisions you make every week or month, such as whether to chase a customer, reorder stock, or hire. Then ask which number would help each decision.
- Pick five to seven KPIs covering cash, sales, margin, customers and operations, with at least two leading indicators.
- Write a definition card for each: formula, data source, frequency, owner, target and alert level.
- Fill in the last 6–12 months from existing records to see your baseline before you set targets.
- Start the 30-minute weekly review and run it for three months. Then drop any KPI that never led to a decision and replace it with one that would.
This article is general information, not advice for a specific business. The scorecard, targets and figures above are illustrative examples.