MRR, Churn and Cohorts: Measure Recurring Revenue the Right Way
How to count MRR without one-off items, build a five-part MRR bridge, measure churn three ways, and read a cohort table to see if newer customers stay longer, with a worked example.

In this article
Businesses that bill customers every month, such as subscription software, managed IT services or maintenance contracts, often look only at total monthly sales and conclude they are growing. That total hides the two things that matter most: how well existing customers stay, and whether new revenue comes from new customers or from existing customers buying more.
This article shows how to measure monthly recurring revenue (MRR), churn and cohorts correctly, with a worked example you can rebuild in an ordinary spreadsheet.
What MRR Is and What It Leaves Out
MRR is the revenue you expect to recur every month from contracts or subscription plans still active at month end. It is a management metric for direction, not the revenue in your financial statements, which follows accounting standards and may differ from MRR.
- Include monthly subscription fees after discounts actually given, and annual plans divided by 12.
- Exclude setup fees, first-time implementation, training, one-off consulting and hardware.
- Exclude free trials, verbal commitments without a contract, and quotes not yet closed.
- Exclude VAT. Always use amounts before VAT.
A common error is multiplying one month's sales by 12 and calling it annual recurring revenue (ARR). The a16z article "16 Startup Metrics" warns that this shortcut often overstates the figure, because it mixes in one-time items and bookings for services not yet delivered. A customer who prepays 120,000 baht for a year does not add 120,000 baht to that month's MRR. It adds 10,000 baht a month for the life of the contract.
The MRR Bridge: Where This Month's Revenue Came From
Instead of comparing MRR at the start and end of the month, split the change into five parts.
Ending MRR = Starting MRR + New + Expansion − Contraction − Churned
Illustrative example: a restaurant management software company sold on monthly subscriptions starts the month with 250 customers and MRR of 500,000 baht.
| Item | MRR (baht) | Note |
|---|---|---|
| Starting MRR | 500,000 | 250 customers |
| + New | 40,000 | 20 new customers |
| + Expansion | 25,000 | Existing customers add branches or upgrade |
| − Contraction | −5,000 | Existing customers reduce seats |
| − Churned | −15,000 | 10 customers cancel |
| Ending MRR | 545,000 | 260 customers |
MRR grew 9% in one month, but the bridge says more. Of the 45,000 baht increase, 40,000 baht came from new customers and a net 5,000 baht from existing ones (25,000 − 5,000 − 15,000). If new sales slow next month, the business can still grow from its installed base, which is a good sign.
Churn: Measure It Three Ways, Never Just One
Using the same example, every denominator is the starting figure. Customers added during the month are left out.
Customer churn = Customers lost ÷ Starting customers = 10 ÷ 250 = 4.0%
Gross revenue churn = (Contraction + Churned) ÷ Starting MRR = (5,000 + 15,000) ÷ 500,000 = 4.0%
Net revenue churn = (Contraction + Churned − Expansion) ÷ Starting MRR = (20,000 − 25,000) ÷ 500,000 = −1.0%
Negative net churn means the same group of existing customers now pays more than at the start of the month, even after cancellations. Put the other way, net revenue retention = (500,000 + 25,000 − 5,000 − 15,000) ÷ 500,000 = 101%.
a16z recommends always looking at gross churn alongside net churn, because net churn offsets losses with upsells and makes them look smaller than they are. In this example, 4% a month sounds modest. Sustained for a year:
Share of customers left after 12 months = (1 − 0.04) to the 12th power = 0.96 to the 12th power ≈ 61%
That means losing about 39% of existing customers a year. The company must replace nearly four in ten customers every year before it grows at all. The figure is not 4% × 12 = 48%, because each month's churn applies to a shrinking base.
Cohorts: Do Newer Customers Stay Longer?
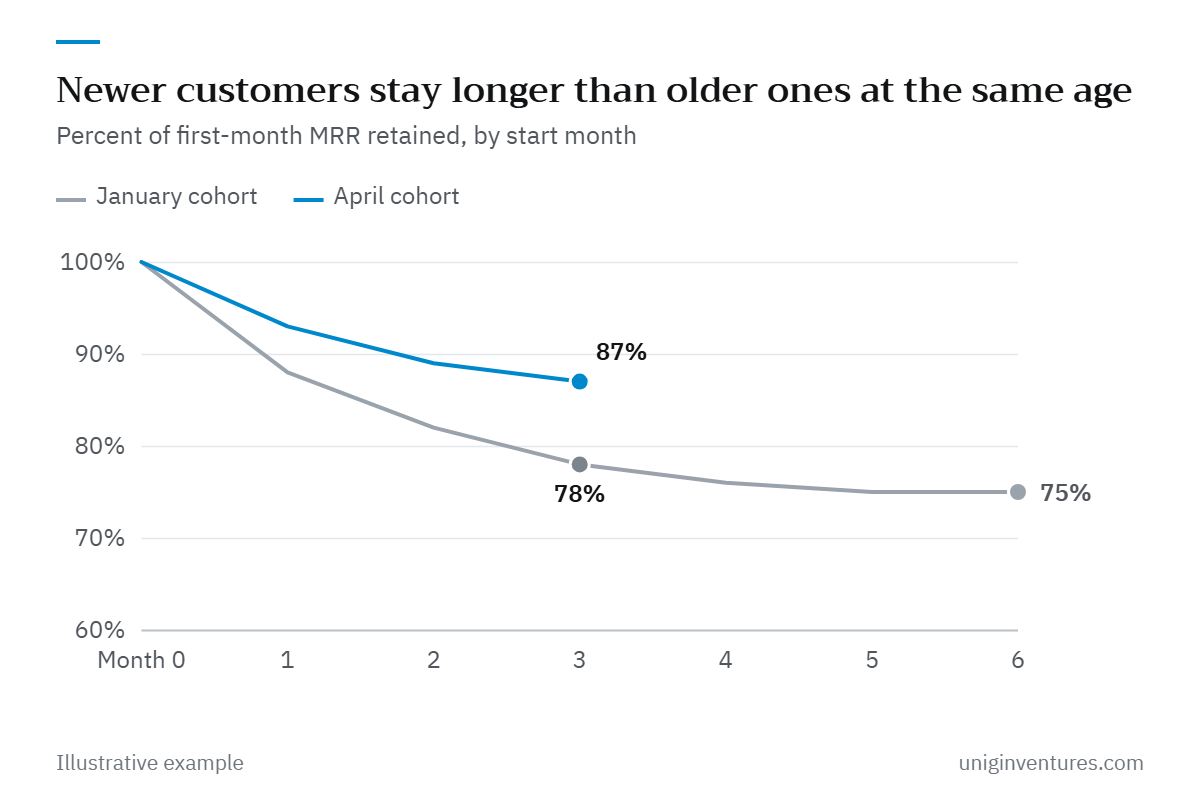
A company-wide churn rate blends customers who have stayed three years with customers who signed up last month. Cohort analysis groups customers by the month or quarter they started, sets each cohort's first-month MRR to 100%, and tracks how much of it remains in later months.
Illustrative example comparing two cohorts at the same company:
| Cohort | Month 0 | Month 1 | Month 2 | Month 3 | Month 4 | Month 5 | Month 6 |
|---|---|---|---|---|---|---|---|
| Started January | 100% | 88% | 82% | 78% | 76% | 75% | 75% |
| Started April | 100% | 93% | 89% | 87% | – | – | – |
a16z points to two trends in a cohort table:
- Does each cohort's line flatten? The January cohort stops falling at about 75%, which means a core group of customers actually uses the product and stays. If the line keeps falling, the business must keep refilling with new customers forever.
- Do newer cohorts beat older ones at the same age? At month 3 the April cohort keeps 87% against 78% for January, a sign that the product, onboarding or customer targeting has improved.
If newer cohorts do worse, the usual cause is an acquisition channel pulling in the wrong customers, for example heavy discount promotions. Check this before raising the marketing budget.
Mistakes That Make the Numbers Look Too Good
- Counting annual prepayments as MRR in full in the month the cash arrives
- Including setup fees and one-off services in MRR or ARR
- Putting customers added during the month into the denominator, which makes churn look lower
- Reporting only net churn without gross churn
- Treating paused or long-overdue accounts as active. Set a clear rule, such as how many days overdue counts as churned, and apply it every month
Investors doing due diligence often ask for monthly customer-level data and recompute the metrics themselves. Definitions that differ from what you presented surface at this stage and weaken trust in your other numbers too.
Where to Start
- Build a customer-by-month table with one row per customer and one column per month, holding that customer's MRR before VAT and excluding one-off items, plus a start-month column.
- Write your definitions on one page: what counts as MRR, how annual plans are treated, and when a customer counts as churned.
- Build the MRR bridge every month with the five parts shown above. Spreadsheet formulas comparing each customer's current and prior month are enough.
- Report all three churn measures together with net revenue retention.
- Update the cohort table every quarter and check whether lines flatten and newer cohorts improve.
With these numbers in hand, decisions on acquisition spending, pricing changes and investment in customer success rest on data rather than on last month's total sales.
All figures in this article are illustrative examples, not industry averages.