Contribution Margin by Product: Which Products Really Make Money
Spreading rent and salaries across products can make you drop one that is helping pay them. Use contribution margin to see which products earn money and what to make first when capacity runs out.

In this article
Owners who sell several products want to know which ones really make money and which to drop. A common approach is to spread rent, salaries and other fixed costs across products, then look for the ones showing a loss. It looks thorough, but it easily leads to the wrong decision, because the rent does not go away when you stop selling one product.
This article uses contribution margin to show how much each product helps pay your fixed costs, when dropping a product really makes sense, and which products to favor when an oven, a machine or staff hours run out. All the numbers are an illustrative example you can swap for your own.
What contribution margin tells you
Contribution margin is the selling price minus variable costs, the costs that rise every time you sell one more unit: materials, packaging, sales commissions and channel fees. What is left over pays your fixed costs, and once those are covered, the rest is profit.
Contribution margin per unit = selling price − variable cost per unit
Contribution margin ratio = contribution margin per unit ÷ selling price
Operating profit = total contribution margin of all products − total fixed costs
The contribution margin ratio tells you how much of every 100 baht of sales is left to cover fixed costs. It is a better way than per-unit margin to compare products with very different prices.
Example: a bakery with three products
In an illustrative example, a bakery supplies cafés and shops with three products. Its monthly figures are:
| Product | Price (baht) | Variable cost (baht) | Contribution per unit (baht) | Contribution margin ratio | Units a month | Total contribution (baht) |
|---|---|---|---|---|---|---|
| Sandwich bread | 40 | 22 | 18 | 45.0% | 3,000 | 54,000 |
| Croissant | 35 | 15 | 20 | 57.1% | 2,000 | 40,000 |
| Cake slice | 60 | 42 | 18 | 30.0% | 1,000 | 18,000 |
| Total | 44.8% | 112,000 |
Revenue is 250,000 baht. Monthly fixed costs are 90,000 baht: rent, staff salaries, oven depreciation, and 10,000 baht for a part-time cake decorator. Operating profit is 112,000 − 90,000 = 22,000 baht.
The trap of spreading fixed costs
If you spread the 90,000 baht of fixed costs by share of revenue, bread takes 48%, or 43,200 baht; croissants take 28%, or 25,200 baht; and cake takes 24%, or 21,600 baht. The result:
| Product | Contribution (baht) | Allocated fixed costs (baht) | Profit after allocation (baht) |
|---|---|---|---|
| Sandwich bread | 54,000 | 43,200 | 10,800 |
| Croissant | 40,000 | 25,200 | 14,800 |
| Cake slice | 18,000 | 21,600 | −3,600 |
| Total | 112,000 | 90,000 | 22,000 |
This table suggests that dropping cake would add 3,600 baht of profit. But if you actually stop selling cake, the only fixed cost that disappears is the 10,000-baht decorator. The rent, the regular salaries and the oven depreciation all stay.
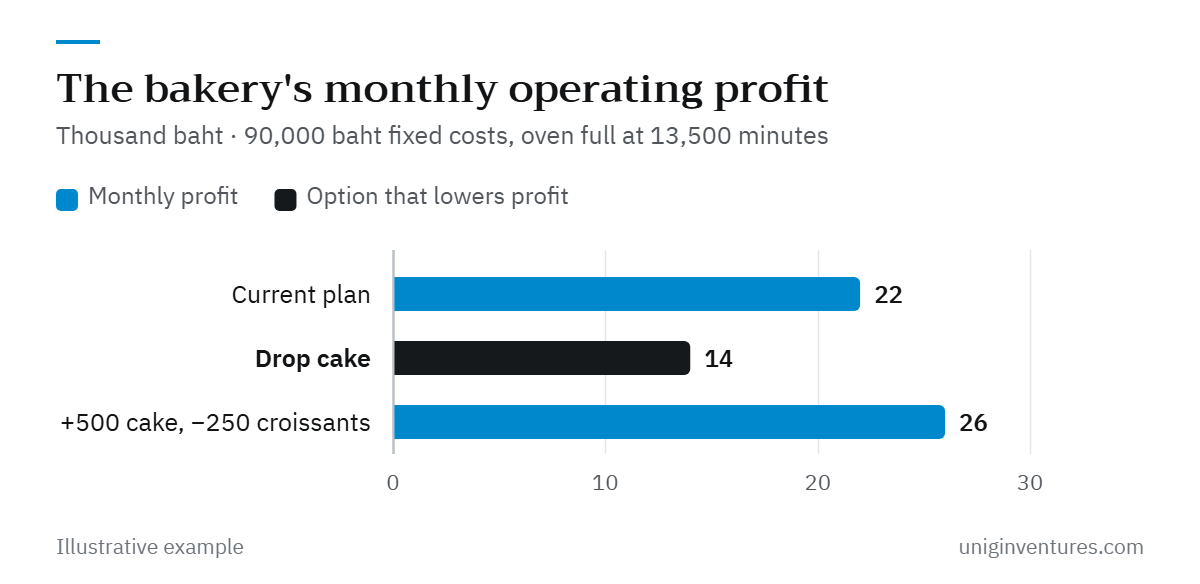
Profit after dropping cake = (112,000 − 18,000) − (90,000 − 10,000) = 94,000 − 80,000 = 14,000 baht
Profit falls from 22,000 to 14,000 baht, because cake brings in 18,000 baht of contribution, more than the 10,000 baht of fixed costs you save. The figure to decide with is contribution minus the fixed costs that would actually disappear if you dropped the product: here 18,000 − 10,000 = 8,000 baht a month. As long as that number is positive, dropping the product lowers total profit. Fixed costs that are allocated to a product but would not go away with it should play no part in the decision.
When a resource is scarce, look at contribution per unit of that resource
If you have spare capacity, it pays to sell more of every product with a positive contribution margin. But once something is full, such as an oven, a technician's hours or shelf space, the question becomes "what should one more unit of the scarce resource be used for?" Rank products by contribution per unit of that resource, not by contribution per unit sold.
In the example, the oven is fully used at 13,500 minutes a month (225 hours), and each product needs a different amount of oven time.
| Product | Oven minutes per unit | Oven minutes a month | Contribution per oven minute (baht) |
|---|---|---|---|
| Sandwich bread | 2 | 6,000 | 9.00 |
| Croissant | 3 | 6,000 | 6.67 |
| Cake slice | 1.5 | 1,500 | 12.00 |
Croissants have the highest contribution per unit but take the longest in the oven. Cake, which looked like a loss-maker after allocation, earns the most per oven minute. If a customer wants 500 more cake slices a month, the bakery needs 750 more oven minutes, which it can free up by making 250 fewer croissants.
Added contribution = (500 × 18) − (250 × 20) = 9,000 − 5,000 = 4,000 baht a month
Operating profit rises to 26,000 baht with no new investment. This assumes customers who get fewer croissants keep buying everything else from the bakery as before. If two products are bought together, include that effect too.
Cautions before you rely on the numbers
- Capture all variable costs. Beyond materials, include packaging, delivery cost per order, sales commissions, and platform or card fees, which are often missed.
- Some costs are only fixed in the short run. Monthly wages look fixed, but if sales grow enough to need another shift, that cost jumps.
- Look by channel and customer too. The same product sold through a platform with high fees can have a very different contribution margin from wholesale.
- A change in sales mix changes the overall ratio. The 44.8% overall ratio in the example is weighted by sales. Selling more cake lowers the overall ratio even as profit in baht rises.
- Some products matter for reasons beyond the numbers, such as an item a major customer buys alongside others. Dropping it could cost you the whole account.
Start with your own business
- Build a contribution margin table for your 10 best-selling products, using actual prices after discounts and variable costs from recent invoices.
- Sort by contribution margin ratio. Products with a very low or negative ratio are the first to review for price or cost.
- Identify fixed costs tied to a single product, such as staff or equipment used only for it, so you know what you would really save by dropping it.
- Find your constraint first, whether machines, people or space, then calculate contribution per unit of that resource to set production and sales priorities.
- Review every quarter, or whenever material prices or channel fees change.
A contribution margin table does not tell you everything, but it gives a checkable answer to "which products make money?" and stops you from dropping a product that is quietly helping pay the rent.