Gross Margin Bridge: Split the Change Into Volume, Mix, Price and Cost
Sales up, gross profit down? It may not be costs alone. Four formulas split the change into volume, product mix, price and unit cost in baht, with a two-channel example and how to read it.
In this article
Sales grew 14% this year, yet gross profit fell. Owners who see numbers like these often get a one-line explanation: "costs went up." That may be only part of the story. Gross profit moves for four reasons at once: you sold more or fewer units, you sold more of the low-margin products, prices changed, and unit costs changed. Unless you split those apart in baht, you cannot tell whether to fix pricing, sales or purchasing.
This article shows how to build a gross margin bridge in an ordinary spreadsheet: four formulas, a two-product example, and how to read the result to make decisions.
What a gross margin bridge is
A gross margin bridge is a table or chart that starts from last period's gross profit, adds or subtracts the effect of each cause one at a time, and lands exactly on this period's gross profit. The pieces must add up to the full difference, with nothing left unexplained.
- Volume effect: selling more or fewer units, assuming the average profit per unit stayed the same.
- Mix effect: the sales mix shifting toward products with higher or lower profit per unit.
- Price effect: changes in unit selling prices, including discounts.
- Cost effect: changes in raw materials, direct labor or inbound freight per unit.
ACCA's examiner's report spells out when a mix effect exists. If every product has the same profit per unit, or the proportions of units sold do not change, the mix effect is zero. Businesses that sell several product groups with very different margins should always separate it out.
The four formulas
These formulas work in baht and need only the units sold, unit price and unit cost for each product group in both periods.
Volume = (total units this period − total units last period) × last period's average profit per unit
Mix = Σ(units this period × last period's profit per unit) − total units this period × last period's average profit per unit
Price = Σ units this period × (price this period − price last period)
Cost = Σ units this period × (cost last period − cost this period)
Last period's average profit per unit is last period's gross profit divided by its total units. This sequence splits volume and mix using last period's unit profits, then measures price and cost on this period's units. Other sequences also work, but each piece comes out slightly different, so use the same sequence every period.
Example: sales up 14%, gross profit down
An illustrative example: a bottled sauce maker sells through two channels, wholesale to retailers (group A) and direct online (group B).
| Group | Last year: units | Price | Cost | This year: units | Price | Cost |
|---|---|---|---|---|---|---|
| A wholesale | 10,000 | 100 | 70 | 14,000 | 98 | 74 |
| B online | 5,000 | 150 | 90 | 4,000 | 155 | 92 |
Last year, sales were 1,750,000 baht and gross profit 600,000 baht, a 34.3% gross margin. This year, sales reached 1,992,000 baht, up 13.8%, but gross profit fell 12,000 baht to 588,000 baht. The gross margin dropped to 29.5%.
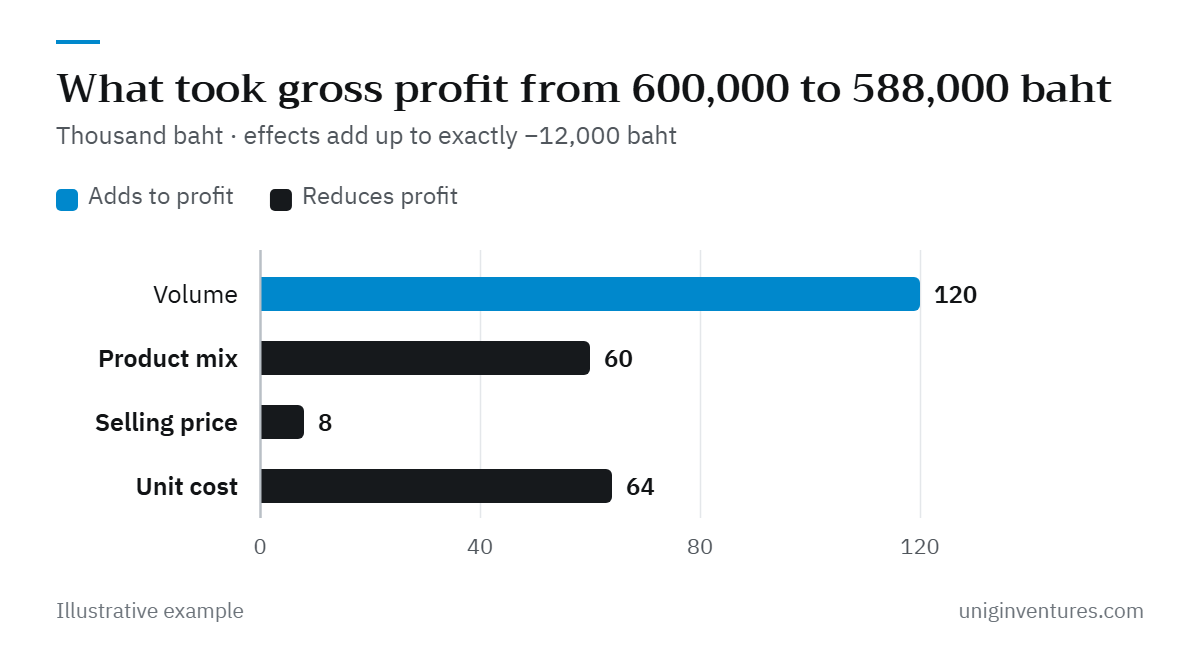
Last year's average profit per unit was 600,000 ÷ 15,000 = 40 baht. The 12,000 baht difference breaks down as follows.
| Item | Calculation | Effect |
|---|---|---|
| Last year's gross profit | 600,000 | |
| Volume | (18,000 − 15,000) × 40 | +120,000 |
| Mix | (14,000 × 30 + 4,000 × 60) − 18,000 × 40 | −60,000 |
| Price | 14,000 × (−2) + 4,000 × 5 | −8,000 |
| Cost | 14,000 × (−4) + 4,000 × (−2) | −64,000 |
| This year's gross profit | 588,000 |
Reading the result
The example reveals what "costs went up" hides.
- Growth came from the low-margin channel. Wholesale added 4,000 bottles while online lost 1,000. The −60,000 baht mix effect is nearly as large as the cost effect. The next questions are why online declined and whether the wholesale expansion was bought with discounts.
- The wholesale discount nearly cancelled the online price increase. Cutting the wholesale price by 2 baht a bottle cost 28,000 baht. Raising the online price by 5 baht recovered 20,000 baht.
- Wholesale unit cost rose 4 baht a bottle, twice as much as online. If that came from packaging or freight used only for wholesale, it belongs in the next round of negotiations with retailers.
Profit per wholesale bottle fell from 30 to 24 baht, while online rose from 60 to 63 baht. For next year's targets, the numbers to watch are not total sales but profit per unit and the share of each channel.
Watch-outs in practice
- Units must be comparable. If one group counts bottles and another kilograms, the mix effect is distorted. FTI Consulting recommends a consistent unit of measure or a line-by-line calculation.
- New and discontinued products have no price in the other period to compare against. Give them their own line in the bridge instead of mixing them into the price effect.
- More detail means more accuracy. At the level of broad groups, a shift toward pricier items within a group shows up as a price effect, not a mix effect.
- Unit costs must come from a correct close. If the inventory costing method or cost allocation changed during the year, the cost effect will include that accounting change.
Where to start
- Pull three columns per product group: units sold, sales and cost of sales for the two periods you are comparing. Divide to get unit price and unit cost.
- Start with three to five groups, split by channel or product family where margins clearly differ. Add detail as your data allows.
- Put the four formulas in a spreadsheet and check that they add up to the actual change in gross profit.
- Run it every quarter with the close, using the same calculation sequence each time.
- Write one line per piece explaining the cause and who owns it. The largest piece is the first conversation.
To see which products make money after all variable costs, read contribution margin by product. If the price effect stays negative for several periods, value-based pricing may help.
The company and figures in this article are an illustrative example of the method.